[Future Technology Research Index]
[SGI Tech/Advice Index]
[Nintendo64 Tech Info Index]
[WhatsNew]
[P.I.]
[Indigo]
[Indy]
[O2]
[Indigo2]
[Crimson]
[Challenge]
[Onyx]
[Octane]
[Origin]
[Onyx2]
(check my current auctions!)
195MHz R10000 Performance Comparison Between O2,
Indigo2, Octane, Origin200, Origin2000 and Power Challenge
Last Change: 09/Aug/1998
SPECfp95 Analysis
SPECint95 Analysis
(Note: the 2D bar graphs shown on this page for the
various SPEC95 tests have been drawn to the same scale)
(the graphs are also to the same scale as those given on the 250MHz
R10000 comparison page)
195MHz R10000 SPECfp95 Performance
Comparison
Introductory Notes:
- SPECfp95 now permits autoparallelisation, ie. a compiler can
parallelise code on multiple-CPU systems as long as this is done
automatically, ie. no special flags can be used. The analysis given
here does not include autoparallelised results because, in my
opinion, they are not directly comparable with single-CPU results
since some tests are affected enormously, some are accelerated only
to a limited degree whilst the remainder are left totally unchanged.
Worse still, different vendors' compilers accelerate a different
selection of the ten tests from the SPECfp95 suite.
Thus, one may see similar results from two rival systems with the
same number of CPUs from different vendors, when in fact the
individual test results for the rival systems are totally different
(ie. a different subset of the tests are accelerated, but end up
leading to a similar final average). I shall construct a page
discussing autoparallelised results for R10000 at a later date. This
study will continue to be an examination of the behaviour of a single
R10000 195MHz CPU in different systems. Note that I strongly
recommend you do not use the final averages from autoparallelised
results at all since, in my opinion, they can be highly misleading.
John McCalpin, a
senior Performance Analyst at SGI and author of the STREAM memory
bandwidth benchmark, told me:
-
"I agree completely with your comments on the auto-parallelized SPECfp
results. By not allowing even the addition of comments, the SPEC
committee has practically invited vendors to invest time in
"special-case" compiler optimizations that are not likely to be of
help in the real world. SGI's automatic parallelization technology
is good, so our results are good, but the whole approach is too
fragile/sensitive to be a good thing.
...
It is not always easy to know what can and cannot be parallelized.
Taking the standard tests and allowing the addition of compiler
directives for the parallel runs would be appropriate for this
sort of test."
- SGI revised its compiler technology in early 1998; after the
change, SGI released new Origin2000 SPEC95 figures, showing minor
improvements to floating point (fp) performance and major
improvements to integer (int) performance. The diagrams and tables on
this page use the better figures released after the compiler change -
their relation to older figures is not discussed.
- A key feature of the operation of the R10000 does not operate in
certain systems that cannot support it. This has an impact on certain
tests and so is discussed, though not in great detail since it is
difficult to know which tests are affected and to what degree.
Objectives
I compared the test results for the R10000 on various SGI systems.
The goal was to discover how the same processor (in this case
the 195MHz R10000) behaved on different SGI systems that supported
it. It's interesting to see which systems are affected by a greater
L2, which are improved by a new architectural design or faster bus,
etc., and which hardly vary at all, ie. perhaps they'd be faster
simply with a better clock speed, as opposed to higher memory I/O, L2
cache size, etc.
To aid visualisation, I've constructed a 3D Inventor model of the
data; screenshots of this are included below. You can download the 3D model (1232bytes
gzipped) if you wish: load the file into SceneViewer or ivview
and switch into Orthographic mode (ie. no perspective). Rotate the
object 30 degrees horizontally and then 30 degrees vertically (use
Roty and Rotx thumbwheels) - that'll give you the standard isometric
view. I actually found slightly smaller angles makes things a little
clearer (15 or 20 degrees) so feel free to experiment. Changing the
direction of the headlight can also help. Note that newer versions of
popular browsers may be able to load and show the object directly,
although I've found such browsers may not offer Orthographic
viewing.
All source data for this analysis came from www.specbench.org.
Note: The R10000 used in Origin200 in this
analysis is 180MHz, not 195MHz (the latter is not available for
Origin200 due to XIO timing issues). The figures for Origin200 given
here have not been scaled by 195/180 in an attempt to take
account of this, so please bare in mind that Origin200 results are
for a lower-clocked R10000. If one does scale Origin200 figures by
195/180 (just over 8%), then the differences between Origin200 and
other systems are lessened, but there is little point in comparing
published results to something which is not available as a buyable
system. Besides, scaling SPEC test results in a linear manner is not
recommended.
Given below is a comparison table of the various R10000/195 SPECfp95
test results. Faster systems are leftmost in this table (in the
Inventor graph, they're placed at the back). You may need to widen
your browser window to view the complete table. After the table and
3D graphs is a short-cut index to the original results pages for the
various systems.
Key:
- O200 = Origin200
O2000 = Origin2000
PChall = Power Challenge
I2 = Indigo2
System:   O2000    Octane    O200    PChall   PChall    I2       O2
L2:        4MB      1MB      1MB      2MB      1MB      1MB      1MB

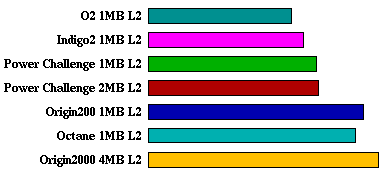
tomcatv    26.9     25.3     22.2     16.7     16.1     12.1     9.78
swim       41.2     40.6     34.5     23.9     23.9     17.1     13.9
su2cor     11.5     9.64     8.47     8.74     7.35     6.40     4.72
hydro2d    12.6     9.97     7.99     6.36     5.03     4.01     3.17
mgrid      18.8     15.9     14.8     11.4     10.4     8.60     6.95
applu      11.7     11.2     11.0     8.69     8.54     7.44     5.92
turb3d     15.3     13.8     14.3     11.3     11.2     10.3     9.57
apsi       15.6     12.8     11.9     15.5     10.3     9.60     9.77
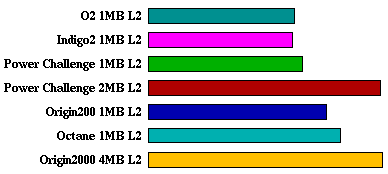
fpppp      29.6     29.7     28.3     31.1     31.3     31.4     29.3
wave5      25.5     22.4     20.3     21.3     18.4     17.3     11.8

          SPECfp95 Comparison Table for MIPS R10000 195MHz
![[Left Isometric View]](spec95/left.gif)
![[Right Isometric View]](spec95/right.gif)
(click on the images above to download larger versions of the views
shown)
Next, a separate comparison graph for each of the ten SPECfp95 tests:
tomcatv:

swim:

su2cor:
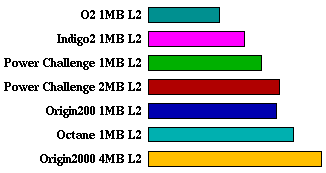
hydro2d:
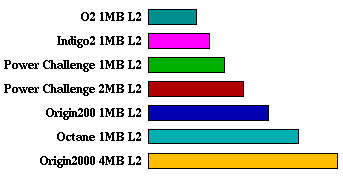
mgrid:
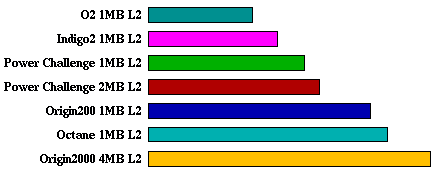
applu:
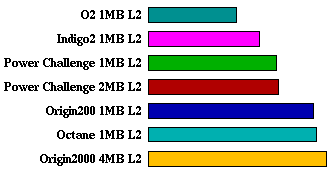
turb3d:
apsi:
fpppp:

wave5:

Note: for Origin200, the peak apsi SPEC ratio (11.9) is less
than the base apsi SPEC ratio (12.6) shown in the submitted
results on www.specbench.org. This is apparently due to a mistake
in the flags used for the peak test run.
Observations
These are easier to spot from the graphs, which is why I made them in
the first place:
- some tests vary hardly at all between the six systems, so what is
the bottleneck for such cases? (eg. fpppp) It can't be memory
bandwidth, L2 size, etc. Is it just straight clock speed? If so,
existing faster-clocked systems should get much higher results, but
some don't (eg. 500MHz Alpha gets 38.3; if clock speed was the key
factor, it should be nearer 80). So what's going on?
Apparently, the fpppp data set is quite small and will fit nicely
into a typical L2 cache; in fact, fpppp can fit into a reasonably
sized L1 data cache. This is why the fpppp results do not vary
amongst the different R10000 systems - in all cases, the CPU is going
as fast as it can and is not being hindered by latency and bandwidth
factors concerning main RAM, or L1<-->L2 cache transfer
issues. Notice, therefore, that despite the problems with R10000 in
O2, the fpppp test goes very fast which shows that the factors
affecting an R10K's performance in O2 is not concerned with the CPU
itself, but with the connection between the CPU's L2 cache and the
rest of the system (ie. any task that fits into L1 or L2 cache for
R10K in O2 will run just as fast as Octane).
However, the 21164 has a much smaller L1 data cache and so, even
though it should theoretically run fpppp very quickly based on its
clock speed, in fact it can't because now the bottleneck is
L1<-->L2 data transfer instead of L2<-->RAM transfer. The
21164's L1 data cache is 8K total, compared to the R10000's much
larger 32K. Before the release of 21264 SPEC95 results, I predicted
that the fpppp result for the 21264 would be high since that
processor is not hampered by a small L1 cache (my guess was 80, as
stated earlier). Sure enough, the 575MHz 21264 achieves 82.7 for
fpppp. QED, as the saying goes.
John told me:
-
fpppp actually fits into the L1 cache in the R10000. I suspect that
it won't fit into the 8kB cache in the 21164. The 21164 also has
trouble with branch mispredictions and pipeline stalls here. Note
that the latency of an FP multiply is about the same on the MIPS and
DEC chips: 2 cycles at 200 MHz on the R10000 vs 5 cycles at 500 MHz
on the 21164.
But what is fpppp? I asked John and he said:
-
"It is a horribly convoluted code extracted from an obsolete
molecular dynamics program. Despite Intel's request, it will not be
in SPEC98."
I asked if there was any need at all for a test like fpppp, where the
data set is very small. John replied:
-
"None of the commercial scientific/engineering apps that I have
tested are anywhere near as tiny as fpppp."
Asking for an overall summary, John said:
-
"With the Alpha line, DEC has chosen a long pipeline that runs fast.
As a consequence, some important operations take more cycles. The
21164 can issue independent FP Add instructions at a rate of one per
cycle, but dependent add instructions have a repeat rate of
one per 5 cycles. The R10000 can issue independent FP Add
instructions at a rate of one per cycle, while dependent add
instructions have a repeat rate of one per 2 cycles. The rate for
independent FP Adds is determined by lots of other bottlenecks
in the system(s), while the rate for dependent FP Adds is
about the same for a 500 MHz 21164 and a 195 MHz R10000. This is
visible in the comparable performance delivered on linear finite
element analysis codes, since these are dominated by direct sparse
matrix solvers that have lots of dependent FP arithmetic."
Asking for clarification on 'about the same', John replied:
-
"5 cycles at 500 MHz is the same amount of time as 2 cycles at 200 MHz
(10 ns in each case)."
- 4 tests seem unaffected by larger L2 cache: swim, applu, turb3d
and fpppp.
- 4 tests benefit slightly from larger L2: tomcatv, su2cor, hydro2d and
mgrid.
- 2 tests benefit alot from larger L2: apsi and wave5.
- Many tests benefit greatly from improved main memory systems
(tomcatv, swim, hydro2d, mgrid, applu, turb3d), some tests benefit a
fair amount (apsi and wave5) and one test benefits almost not at all
(fpppp) for reasons given above.
- Clearly, the operation of R10000 in O2 is
hampered by various factors, but it's worth noting that apsi on O2
actually runs faster than it does on Indigo2. apsi is obviously a
task that benefits more from a larger L2 cache than anything else.
- O2 shows the largest variance in performance results for any of the
systems; the difference between highest and lowest is almost an order
of magnitude. From this it can be concluded that the final SPECfp95
average for R10K in O2 should not be used at all as it could easily be
a factor of 3 away from the actual performance one might see from one's
target application (ie. if one judges R10K in O2 based on the final
average, the performance of a real-world problem might be 3 times
slower or 3 times faster, depending on the nature of the code).
- As far as I know, none of the SPECfp95 tests are similar to
geometry/lighting matrix calculations found in 3D graphics. If this
is true, then one cannot use SPECfp95 as an indicator of performance
for 3D graphics applications. Asking for comment, John said:
-
"I know that 102.swim is coded as single precision. I have not looked
at the others... Swim is pretty strongly bandwidth limited on most
systems -- in this case, using 32-bit reals significantly increases
performance.
SWIM is fairly standard long vector code. It does not have the
characteristics of the 4x4 matrix manipulations that characterize
geometry calculations."
Of most note are the performance jumps between Indigo2/IMPACT to
Origin200. Even though the Origin200 has a 180MHz R10000 whilst the
Indigo2/IMPACT has 195MHz R10000, many of the tasks run much better
on the Origin200 by a factor of 2 in many cases. Such tasks are
clearly benefiting from the much higher memory bandwidth (STREAM
result is 5 times higher than Indigo2/IMPACT), lower memory latency
(Origin200's memory latency is about 40% better than Indigo2) and an
additional factor that is discussed below. As the complexity of a
data set becomes larger (ie. data set size increases), the
improvement seen with Origin200 over Indigo2/IMPACT will increase.
However, there is a confusing factor in all this which makes it
difficult to come to precise conclusions as to why some tests perform
in a particular way on a certain system:
- The R10000 supports multiple oustanding cache misses, but
this feature is restricted in certain systems (see section 2.4 of the
R10000
Technical Brief for more information). John commented:
-
"On the O2, Indigo2/10K, and Power Challenge/10K, the system PROM
re-programs the R10000 to only allow 1 outstanding cache miss, since
that is all that the memory system supports. Octane and Origin
systems allow 4 outstanding misses per cpu."
Restricting the number of outstanding cache misses in this way will
have an impact on certain types of code, but it is difficult to
ascertain, without detailed analysis, which of the SPECfp95 tests may
be affected; John's view was, "It is very hard to quantify this."
Cache accessing is obviously an important factor when looking at
performance. I asked John for a summary description of the way
cache systems operate and the relevant issues; he said:
-
"Any time you execute a Load instruction, the CPU checks in the
caches to see if a copy of the data is handy. If the data is in the
primary cache, the CPU proceeds at full speed, and the data can be
used two cycles after the load (on MIPS processors, anyway). If there
is not a copy of the data in the primary cache, the secondary cache
is checked. If there is a copy in the secondary cache, it takes about
9-12 cycles (on the R10000) to get the data. If there is no copy of
the data in the secondary cache, it takes about 65 cycles to get the
data.
If the CPU continues executing other instructions after the Load that
missed the primary cache, you have what is called a "non-blocking"
cache. Some systems allow more loads to occur while the cache miss of
the first load is outstanding, and will continue as long as all the
subsequent loads hit in the cache. This is called a "hit under miss"
cache. Typically a "hit under miss" cache will stall the CPU when a
second cache miss occurs, i.e. the CPU will sit there doing nothing
at all until the data for one of the loads gets returned either by
the secondary cache or by the memory controller.
More sophisticated processors allow multiple outstanding misses,
typically with different numbers of misses allowed at each level of
the memory hierarchy. On the R10000, you can have 4 loads miss the
cache and still continue executing instructions. The information
about these outstanding misses sits in a buffer on the CPU that
matches the data coming in from the secondary cache or main memory
controller with the corresponding instruction."
Apparently, PowerPC 604/604e systems operate a "hit under miss" cache
system.
I asked John for some examples of the types of code which are
sensitive to cache-access issues; he said:
- Traversing linked lists (pointer chasing),
- Using only 1 part of a multi-element structure per loop
iteration,
- Code with lots of branches.
Obviously, the precise reasons why a piece of code performs in a
particular way can be quite complex.
Summary.
I've done this comparison because people still rely heavily on SPEC95
results when making purchasing and upgrade decisions, as I discovered
when helping a colleague with the buying of a new number crunching
system - he eventually ordered an Origin200 (full details given
below). Thus, I hope my 3D graphs can help people understand a little
more about how SPECfp95 is actually behaving on different systems
that use identical processors, Origin200/180 not withstanding.
What this shows, once again, is that it's important not to rely on
final SPEC averages. More than anything, get your code physically
tested on the target system if possible before making a purchasing
decision.
Finally, please also read my page on what I call performance difference profiling - a
technique that I hope may aid those who are involved in making
upgrade decisions.
An Example R10000 Performance Comparison to Indigo2/R4400
and Indy/R5000
A colleague from the University of Central Lancashire's Fire and
Explosion Studies Centre asked me for advice on upgrading from
Indy/Indigo2 (using R4600, R5000 and R4400) to Indigo2/R10000 or
perhaps Origin200.
I arranged for SGI UK to bring along an Indigo2 R10000 195MHz Solid
IMPACT. The Centre then conducted tests on the R10000 Indigo2 to
compare its performance against their existing 133MHz R4600 Indys and
a 200MHz R4400 Indigo2. All the tests involved Fortran77 code using
the MIPS Pro 7.0 compilers, performing 64bit floating point
calculations. These were pure time-based number crunching tests, ie.
no screen output or disk operations were involved.
The results are as follows (factor speedups, ie. how much faster the
Indigo2 R10000/195 was compared to the target system):-
- Standard problem, 50x50 grid, 100 steps:
- 11.4 times faster than Indy R5000SC/150
- Larger Problem, 150x150 grid, 100 steps:
- 5.8 times faster than Indigo2 R4400/200
11.4 times faster than Indy R5000SC/150
- Standard Problem, 51x51 grid, 100 steps:
- 2 times faster than Indigo2 R4400/200
- Larger Problem, 101x101 grid, 10 steps:
- 2.6 times faster than Indigo2 R4400/200
3.2 times faster than Indy R5000SC/150
Other test results; each factor is how much faster the R10000/195
Indigo2 was compared to the R4400/200 Indigo2:
- Pseudospectral algorithm with Fast Fourier Transform:
[l = 2048]:  5.39 times faster
[l = 32768]: 3.41 times faster
- Finite-Difference algorithm in decomposed geometry:
[110x10/50x10/50x10]:       2.13 times faster
[1100x100/500x100/500x100]: 3.10 times faster
- Eigenvalues, LAPACK:
300x300 DGEEV (ordinary):      3.79 times faster
300x300 DGEGV (generalised):   2.89 times faster
1000x1000 DGEEV (ordinary):    2.83 times faster
1000x1000 DGEGV (generalised): 2.35 times faster
195MHz R10000 SPECint95 Performance
Comparison
The systems examined were the same as for the SPECfp95 comparison
given above, including the Origin200 using a 180MHz R10000, so please
bare this difference in mind when examining the
data. Just as above, you can download a 3D performance graph
(gzipped) if you wish: load the file into SceneViewer or ivview
and switch into Orthographic mode (ie. no perspective), etc.
The rationale and method for this examination were the same as for
SPECfp95. Thus, given below is a comparison table of the various
R10000/195 SPECint95 test results. You may need to widen your browser
window to view the complete table. After the table and 3D graphs is
a short-cut index to the original results pages for the various
systems.
Key:
- O200 = Origin200
O2000 = Origin2000
PChall = Power Challenge
I2 = Indigo2
System:   O2000    Octane    O200    PChall   PChall    I2      O2
L2:        4MB      1MB      1MB      2MB      1MB      1MB     1MB

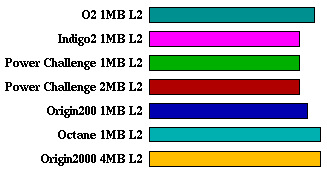
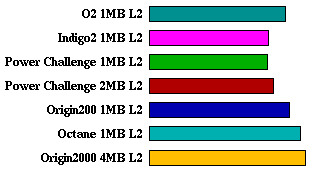
go:        11.4     11.4     10.5     10.0     10.0     10.0    11.0
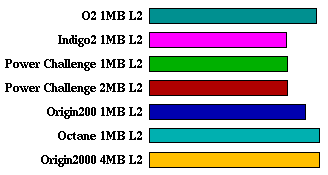
m88ksim:   11.3     11.3     10.4     9.15     9.18     9.14    11.1
gcc:       10.4     10.1     9.26     8.25     7.87     7.91    9.02
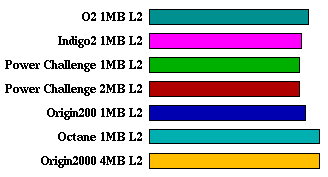
compress:  11.3     11.3     10.4     10.0     10.0     10.1    10.6
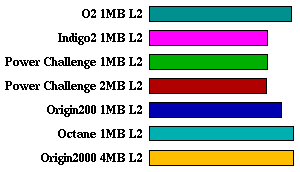
li:        9.57     9.59     8.79     7.79     7.85     7.87    9.42
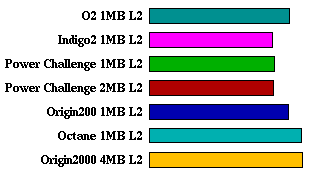
ijpeg:     10.2     10.1     9.26     8.23     8.29     8.20    9.35
perl:      13.3     13.0     12.1     9.42     9.27     10.3    13.0
vortex:    14.4     11.2     12.4     8.25     7.86     7.97    8.20

         SPECint95 Comparison Table for MIPS R10000 195MHz
![[Left Isometric View]](spec95/left2.gif)
![[Right Isometric View]](spec95/right2.gif)
(click on the images above to download larger versions of the views
shown)
Next, a separate comparison graph for each of the eight SPECint95 tests:
go:
m88ksim:
gcc:
compress:
li:
ijpeg:
perl:
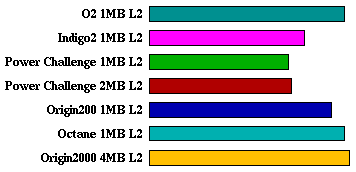
vortex:
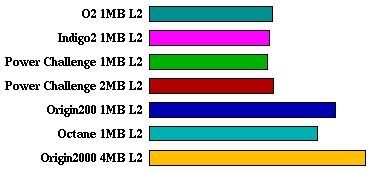
It is immediately obvious that the behaviour of these tests is very
different from the SPECfp95 suite. Firstly, there is a much lower
variance for all the systems. Other observations are:
- Few tests benefit to any significant degree from larger L2
cache. The only test which does is vortex. Note that although some
tests do improve slightly from 1MB L2 PowerChallenge (PChall) to 2MB
L2 PChall (eg. gcc and perl), only vortex shows this behaviour
and a significant jump from 1MB Octane to 4MB Origin2000.
- The Origin architecture is clearly helping all these tests to
some degree, with many showing significant improvements.
- Perhaps most important of all, O2 does very well in virtually all
the tests, almost always outperforming Indigo2, PChall and Origin200
(vortex on 2MB PChall and Origin200 is the only exception), in many
cases very close to Octane in performance (go, m88ksim, li) and in
one case matching Octane exactly (perl).
Vortex is an interesting case. Though O2 does well on all tests,
matching Origin and beating older systems handsomely most of the
time, vortex is the one test where O2 does not do as well as
Origin-based systems. Stranger still, Octane does not do as well as
Origin200 for vortex. It's a shame that vortex is the only test in
SPECint95 which gives rise to this behaviour; if one's code happens
to be like vortex, ascertaining that fact may not be easy. I asked
about vortex; he replied:
-
"vortex in SPECint95 has a lot of trouble with TLB misses, as its
memory access patterns cover a large memory space. The lower latency
of the main memory system (for getting the new TLB entries) helps the
newer machines a fair amount relative to the old machines. Somewhere
along the lines we made an O/S modification that allowed this code to
use large pages and reduce the TLB miss rate -- this modification
would not be reflected in the results on the older machines, but
would help them if we went back and ran the tests again."
Note that SGI does not have the time to rerun tests on older
systems. Running the base tests is trivial, but it isn't easy to
gather together people who can work on finding the best optimising
compiler options for the peak tests. SGI is probably busy enough as
it is testing newer CPUs on the current systems.
The SPECfp95 discussion above refers to the absence of the R10K's
outstanding cache-miss feature on older SGI systems and O2. However,
for SPECint95, this appears to be much less of an issue. vortex might
be an exception but it's difficult to tell without detailed knowledge
of how vortex works. John's view on this was:
-
"Outstanding cache misses are not relevant on SPECint95 because
almost no secondary cache misses occur! With default page sizes, only
vortex and gcc seem to show any benefit from going from 1 MB to 4 MB
caches."
Asking John why no cache misses were happening, his response was:
-
"The jobs are working on small data sets."
The next question had to be, what kind of tasks do use large
data sets? John's reply was:
-
"Database stuff, large cpu simulators, integer
programming/optimization (like travelling salesman problems, airline
scheduling, etc.)"
Finally, given that the 2D graphs above are to the same scale, it's
very clear that the R10000 shows a much larger floating point (fp)
advantage over the SPEC reference system than an integer (int)
advantage and also a greater variance for fp results. However, the
problem with this observation is that one has no way of knowing how
'good' the original reference system was for int vs. fp work.
In other words, one has no way of knowing whether the int and fp
tests were 'equally' difficult for the reference system. It would
have been better perhaps if the tests could have been tailored such
that the variance in reference times between the int and fp tests
were similar; ie. SPEC95's reference times vary between 1400 and 9600
for the fp tests and between 1700 and 4600 for the int tests - it
would have been better if the spread was the same for both test
suites. Also, for SPECfp95, there is an odd correlation between tests
whose reference times are high and final high target system ratios
(swim and fpppp); is this because the reference system ran them
rather slowly, or because SPEC made the tests more complex to slow
them down? It is difficult to know what to conclude. Just a
coincidence? Or were some tests just not tough enough in the first
place? Or maybe there were, but the R10000 is just very good for that
kind of work anyway? Who knows?
Clearly, SPEC95 must be examined in detail to gain any genuinely
useful information.
(check my current auctions!)
[WhatsNew]
[P.I.]
[Indigo]
[Indy]
[O2]
[Indigo2]
[Crimson]
[Challenge]
[Onyx]
[Octane]
[Origin]
[Onyx2]
[Future Technology Research Index]
[SGI Tech/Advice Index]
[Nintendo64 Tech Info Index]
![[Left Isometric View]](spec95/left.gif)
![[Right Isometric View]](spec95/right.gif)
![[Left Isometric View]](spec95/left.gif)
![[Right Isometric View]](spec95/right.gif)


![[Left Isometric View]](spec95/left2.gif)
![[Right Isometric View]](spec95/right2.gif)


